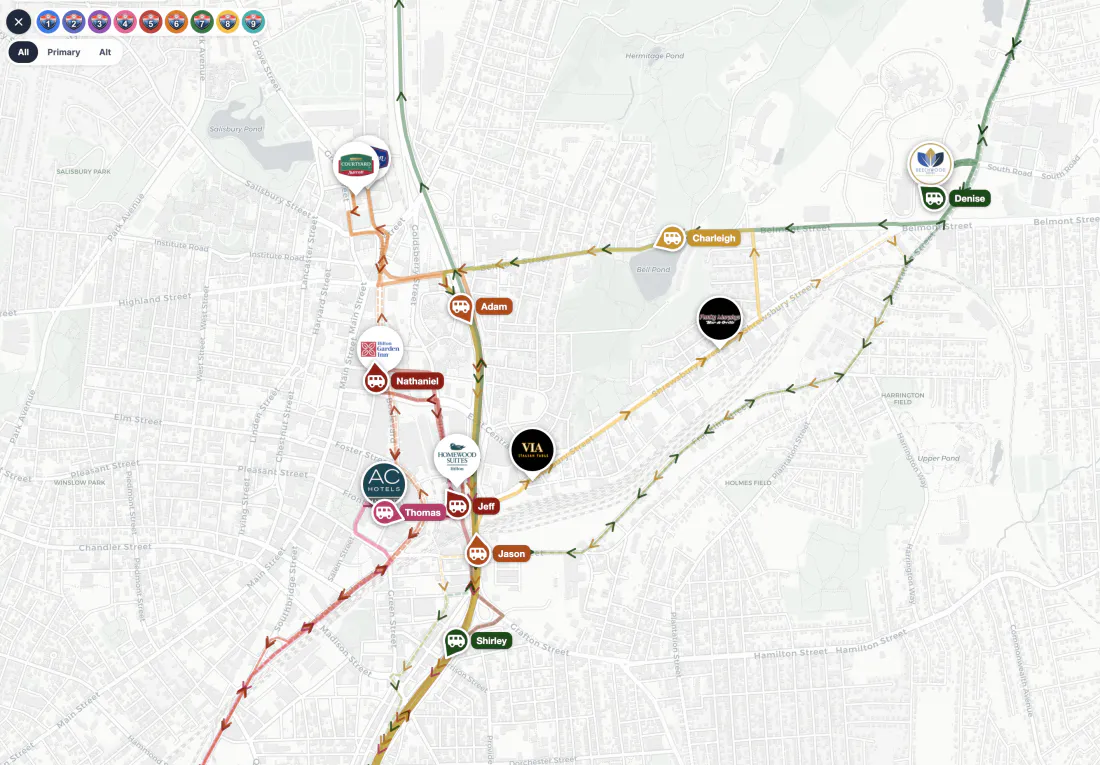
We provide live vehicle tracking and arrival predictions across hotels, parking, venues, and more. Your participants scan a code and see their shuttle. Your operations team sees everything: shuttles, luggage trucks, road crew, even participants.
How it works
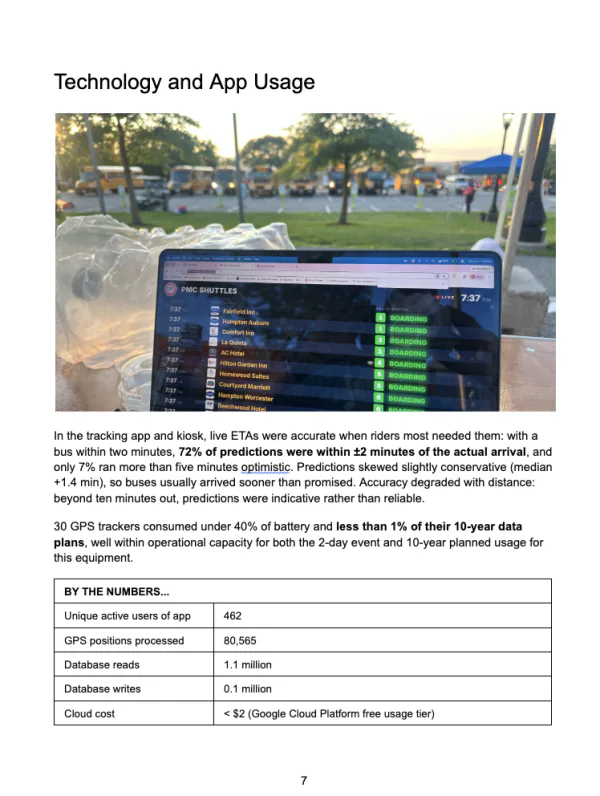
We put a GPS tracker on every vehicle, learn how long every leg really takes, and share the most accurate arrival time estimates with everyone.
For Passengers
We give your passengers a web app. Print our QR codes on your signage and each one opens straight to that stop’s route, already selected.
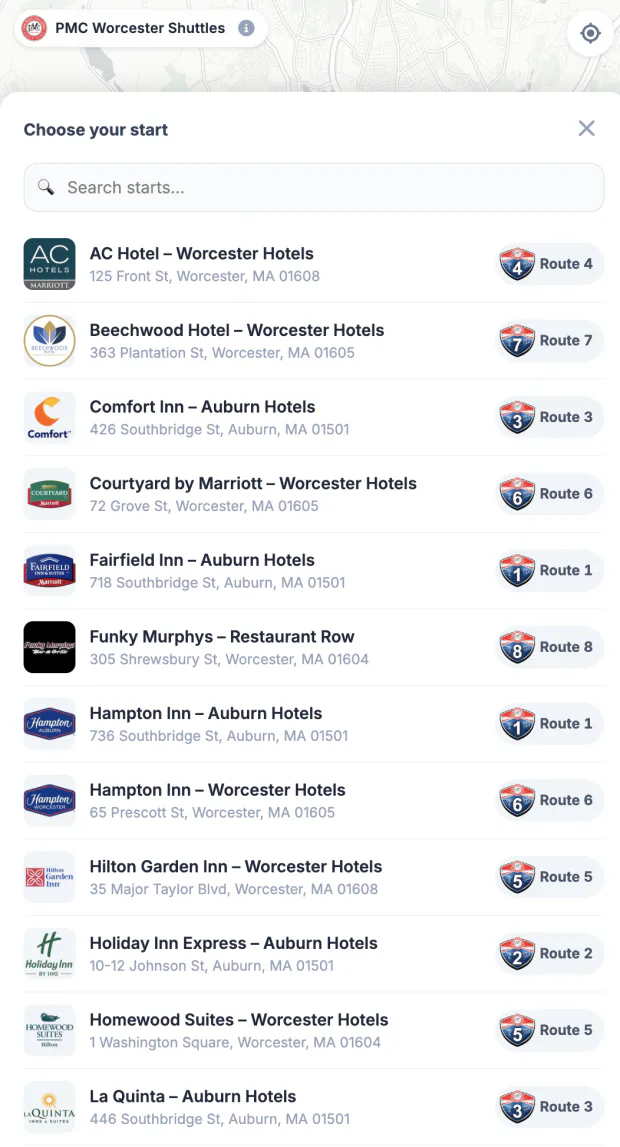
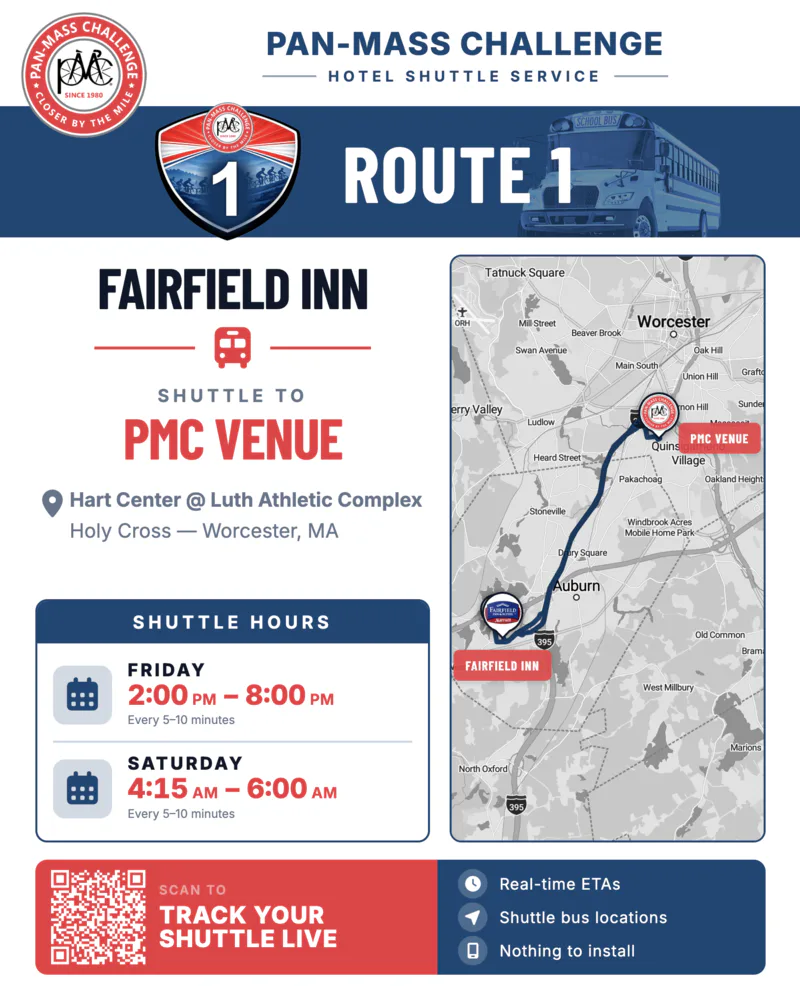
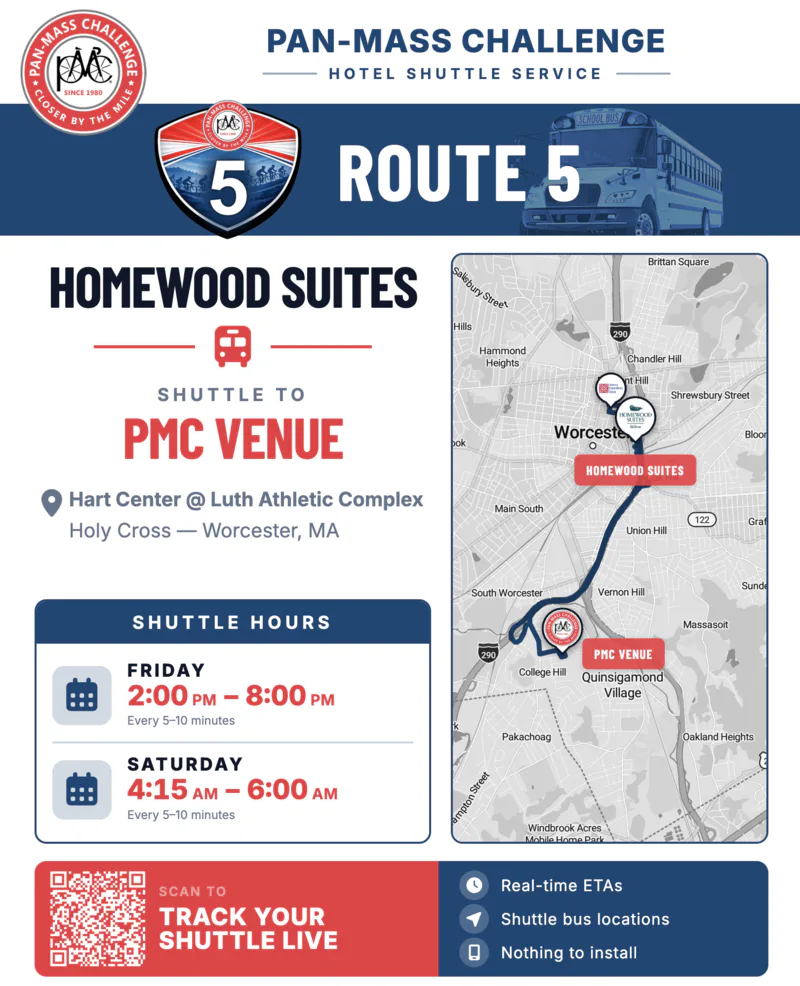
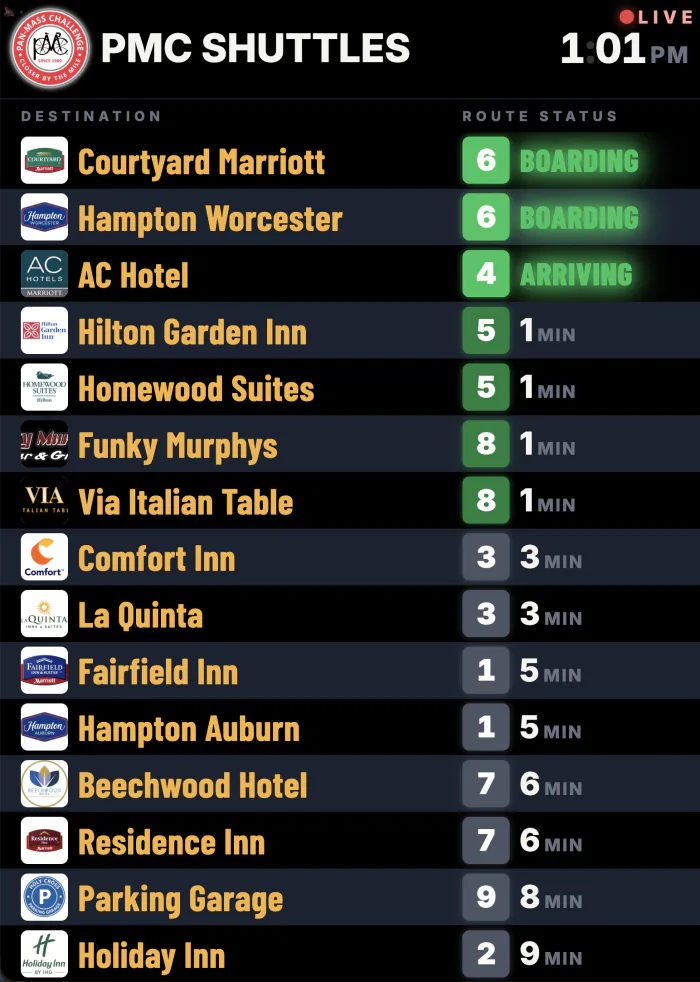
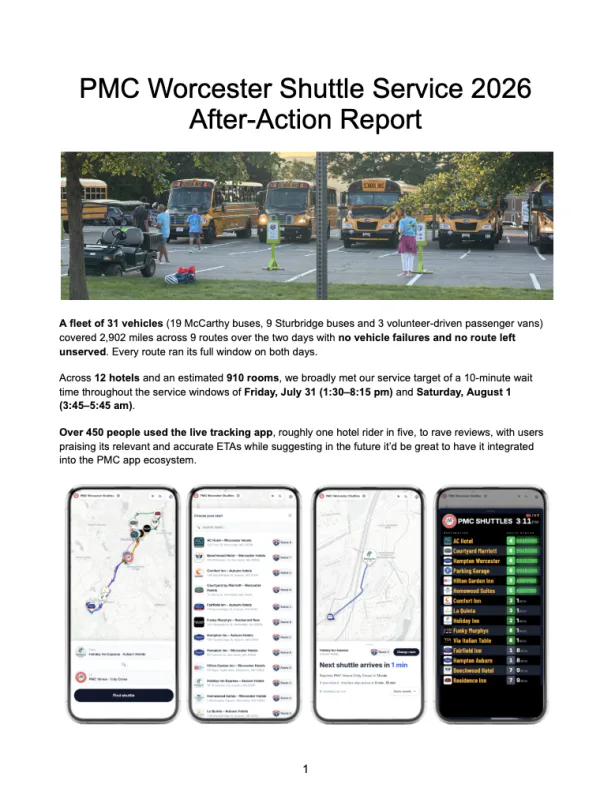
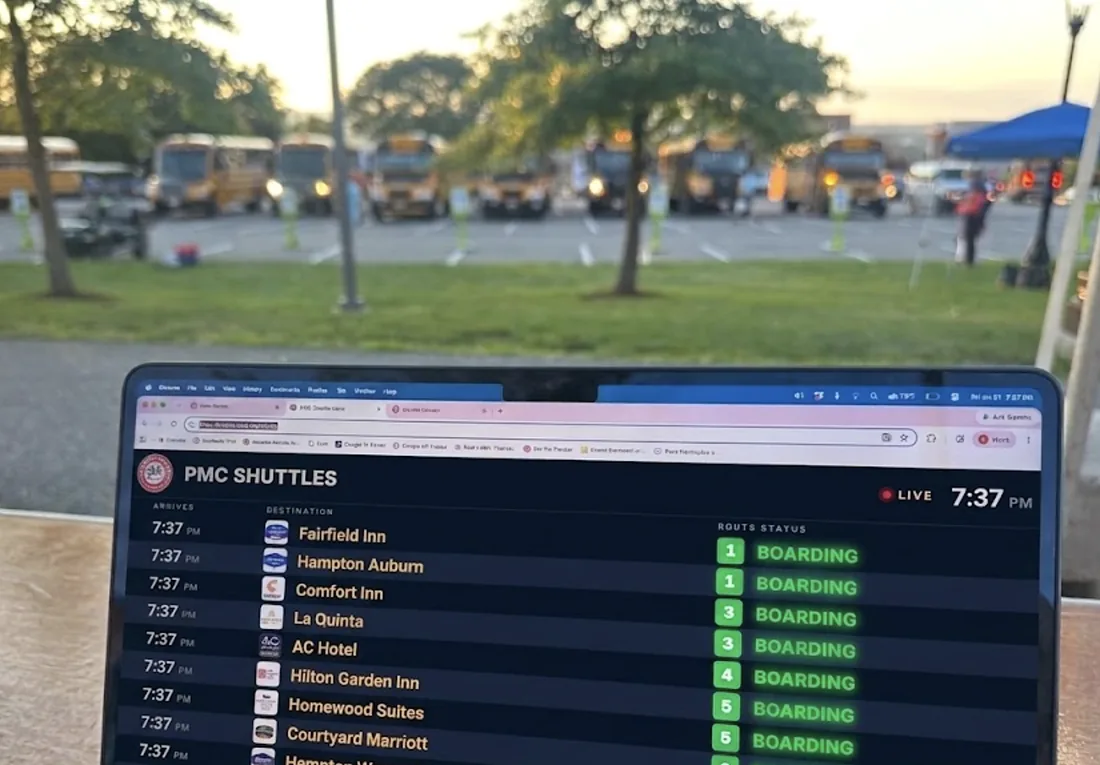
Point any screen you have at the display URL and it runs itself — no app, no operator, no refreshing. We rank every destination your venue serves by who leaves next and announce arrivals aloud, so a departing passenger can read one line or simply listen and know where to stand.
For Operations
You define your routes once. Hand your drivers pre-programmed GPS devices with nothing to install on their phones or plug into their vehicles.
We generate the passenger app, the dispatch console, and the kiosk diplays, all effortlessly kept in sync.
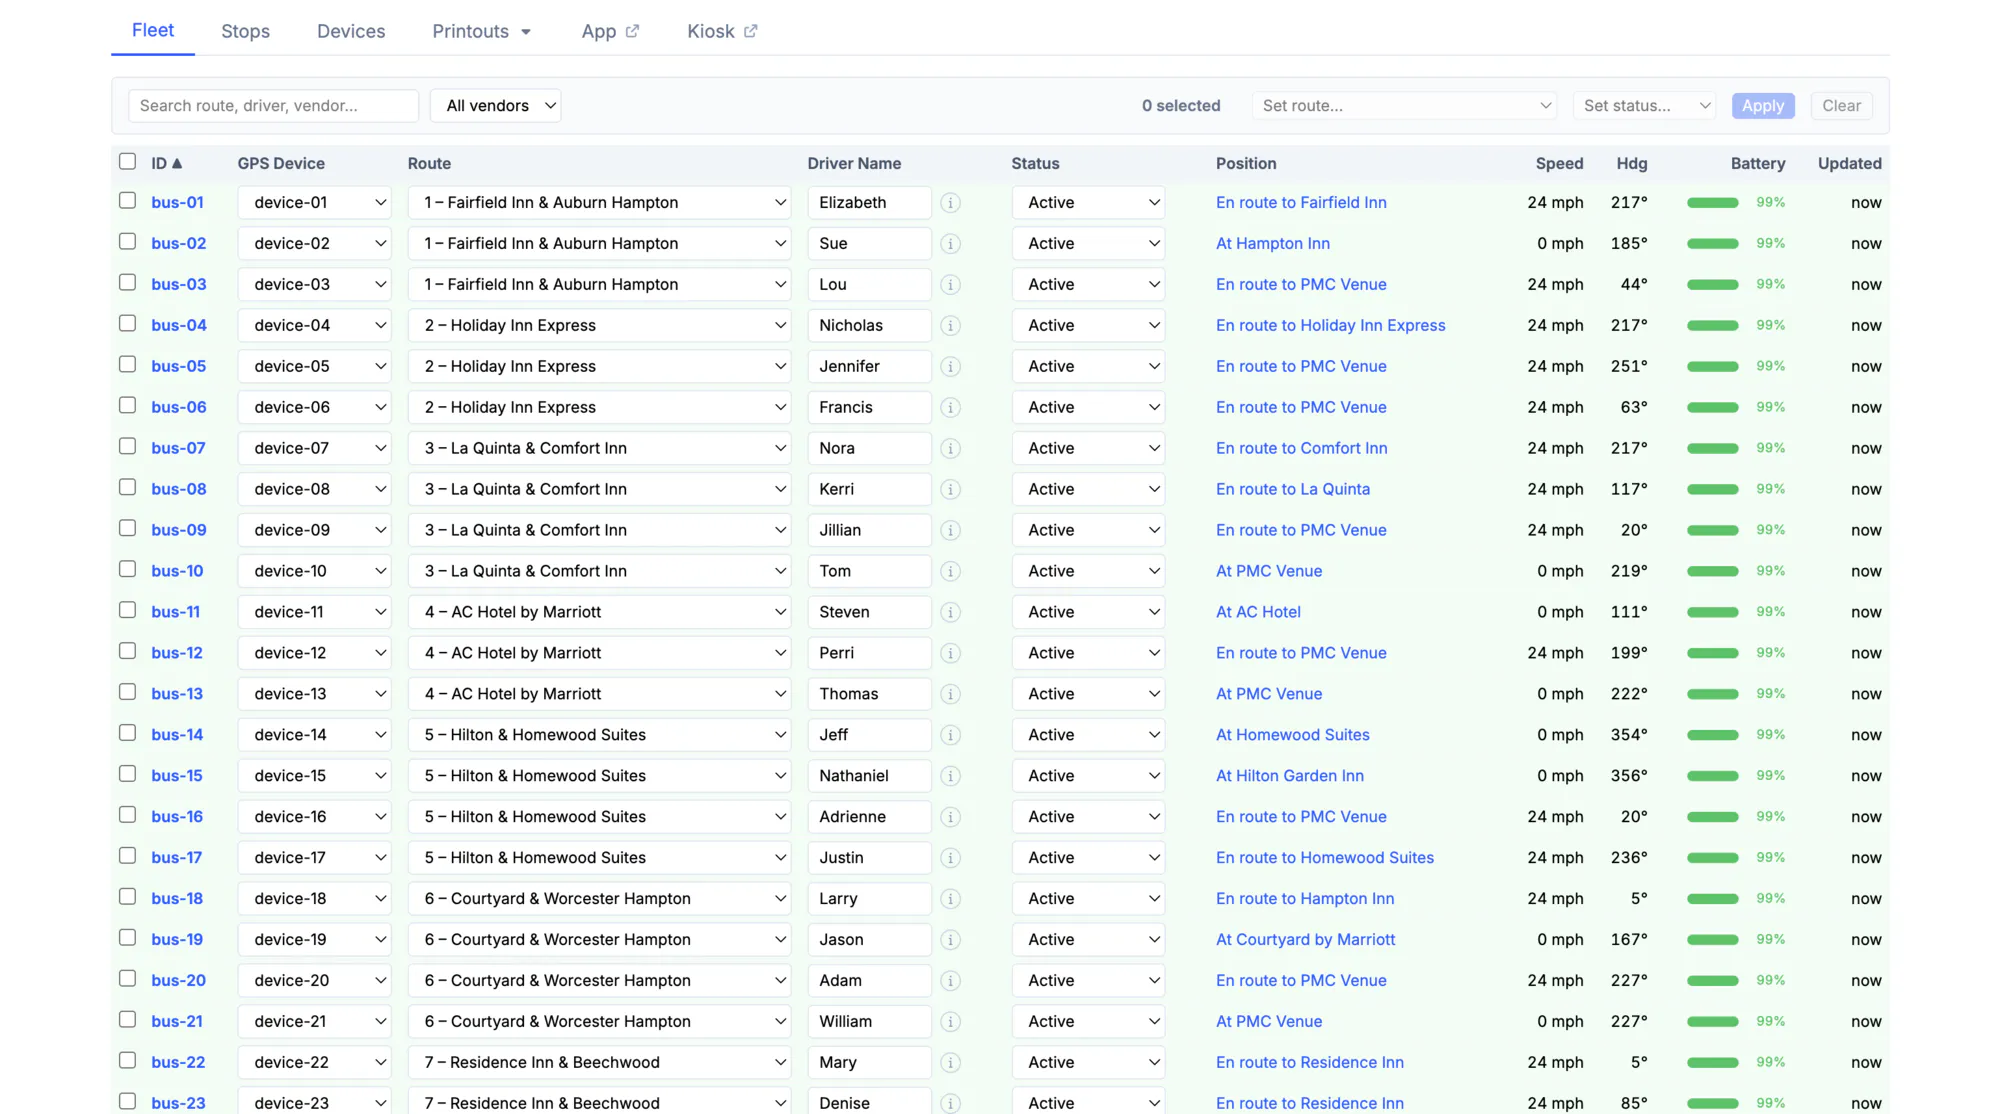
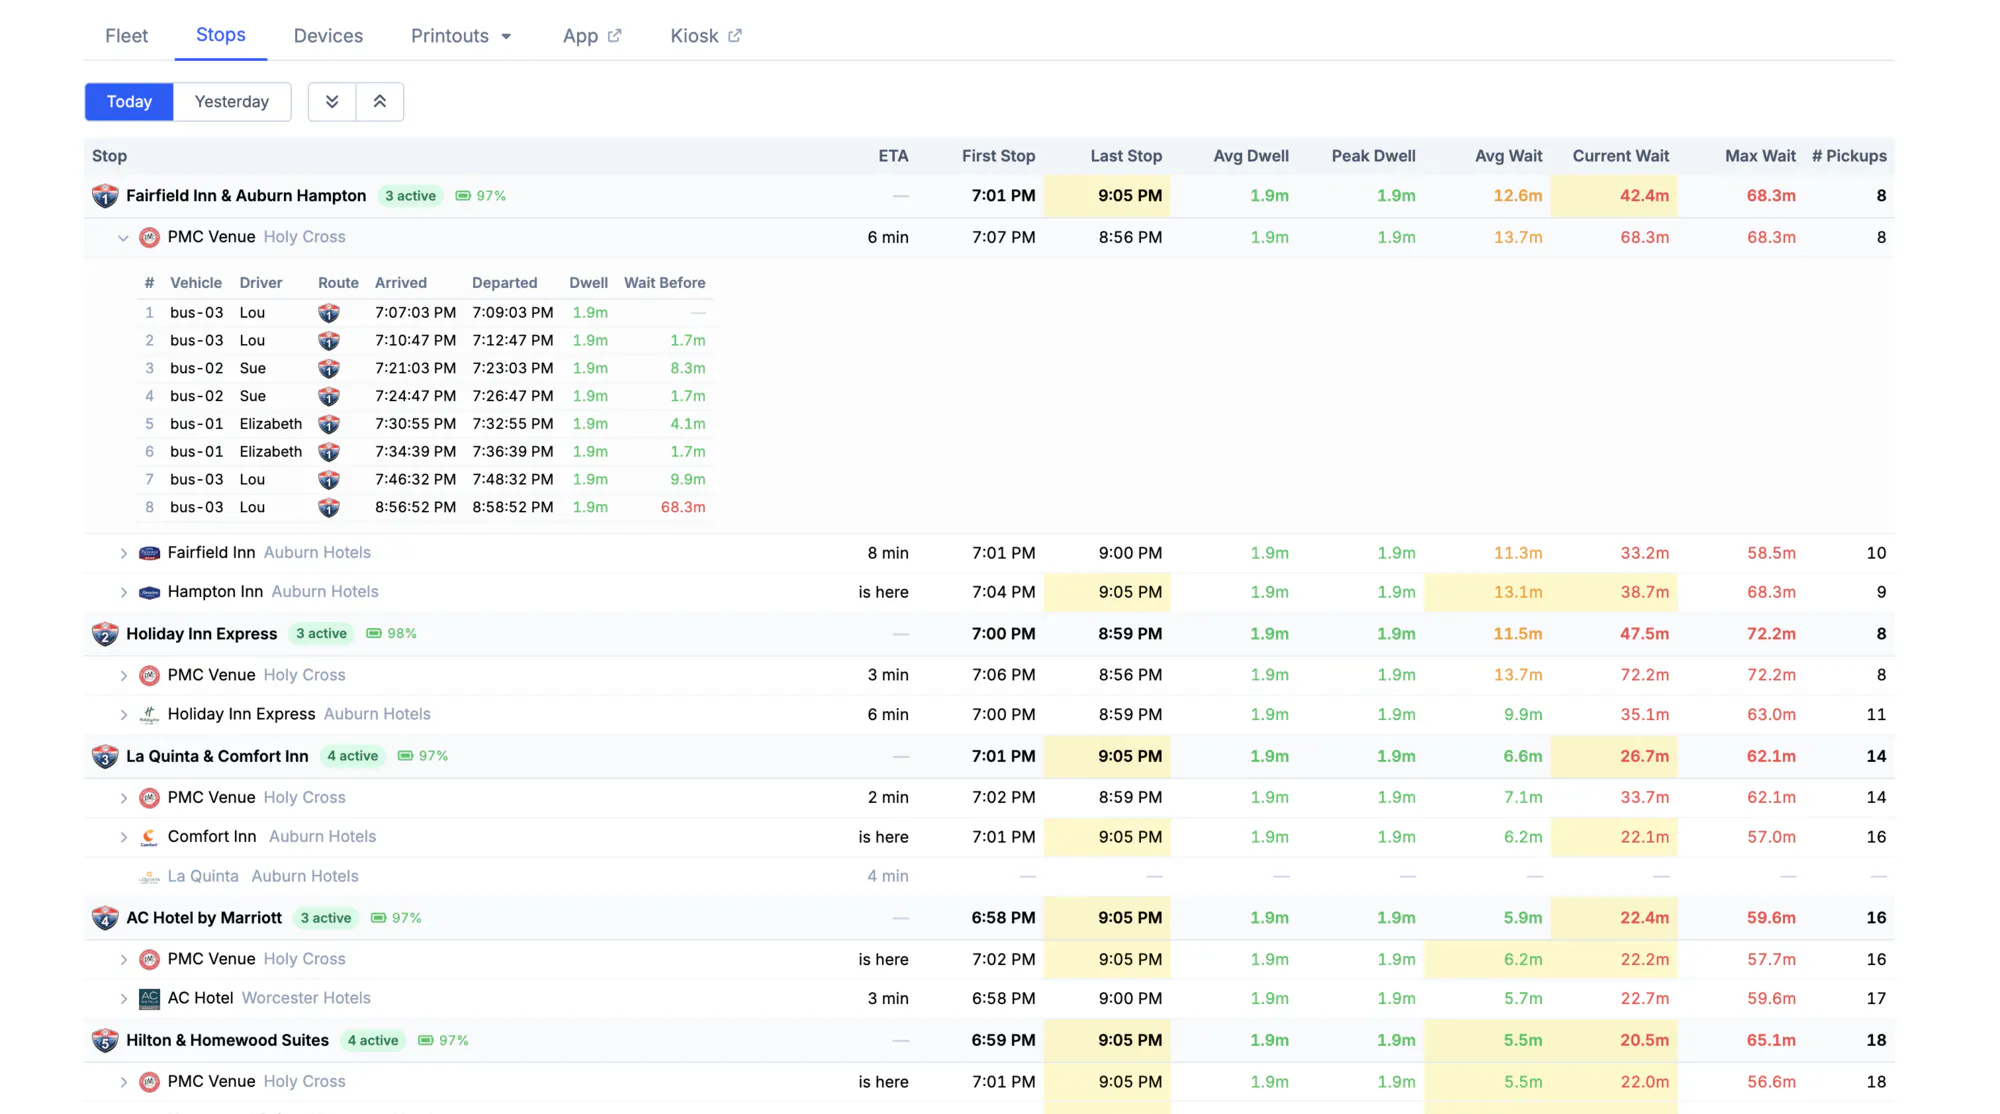
We generate per-driver, per-day run sheets with stop order, timings and maps, so nobody on your team assembles them in a spreadsheet the night before.
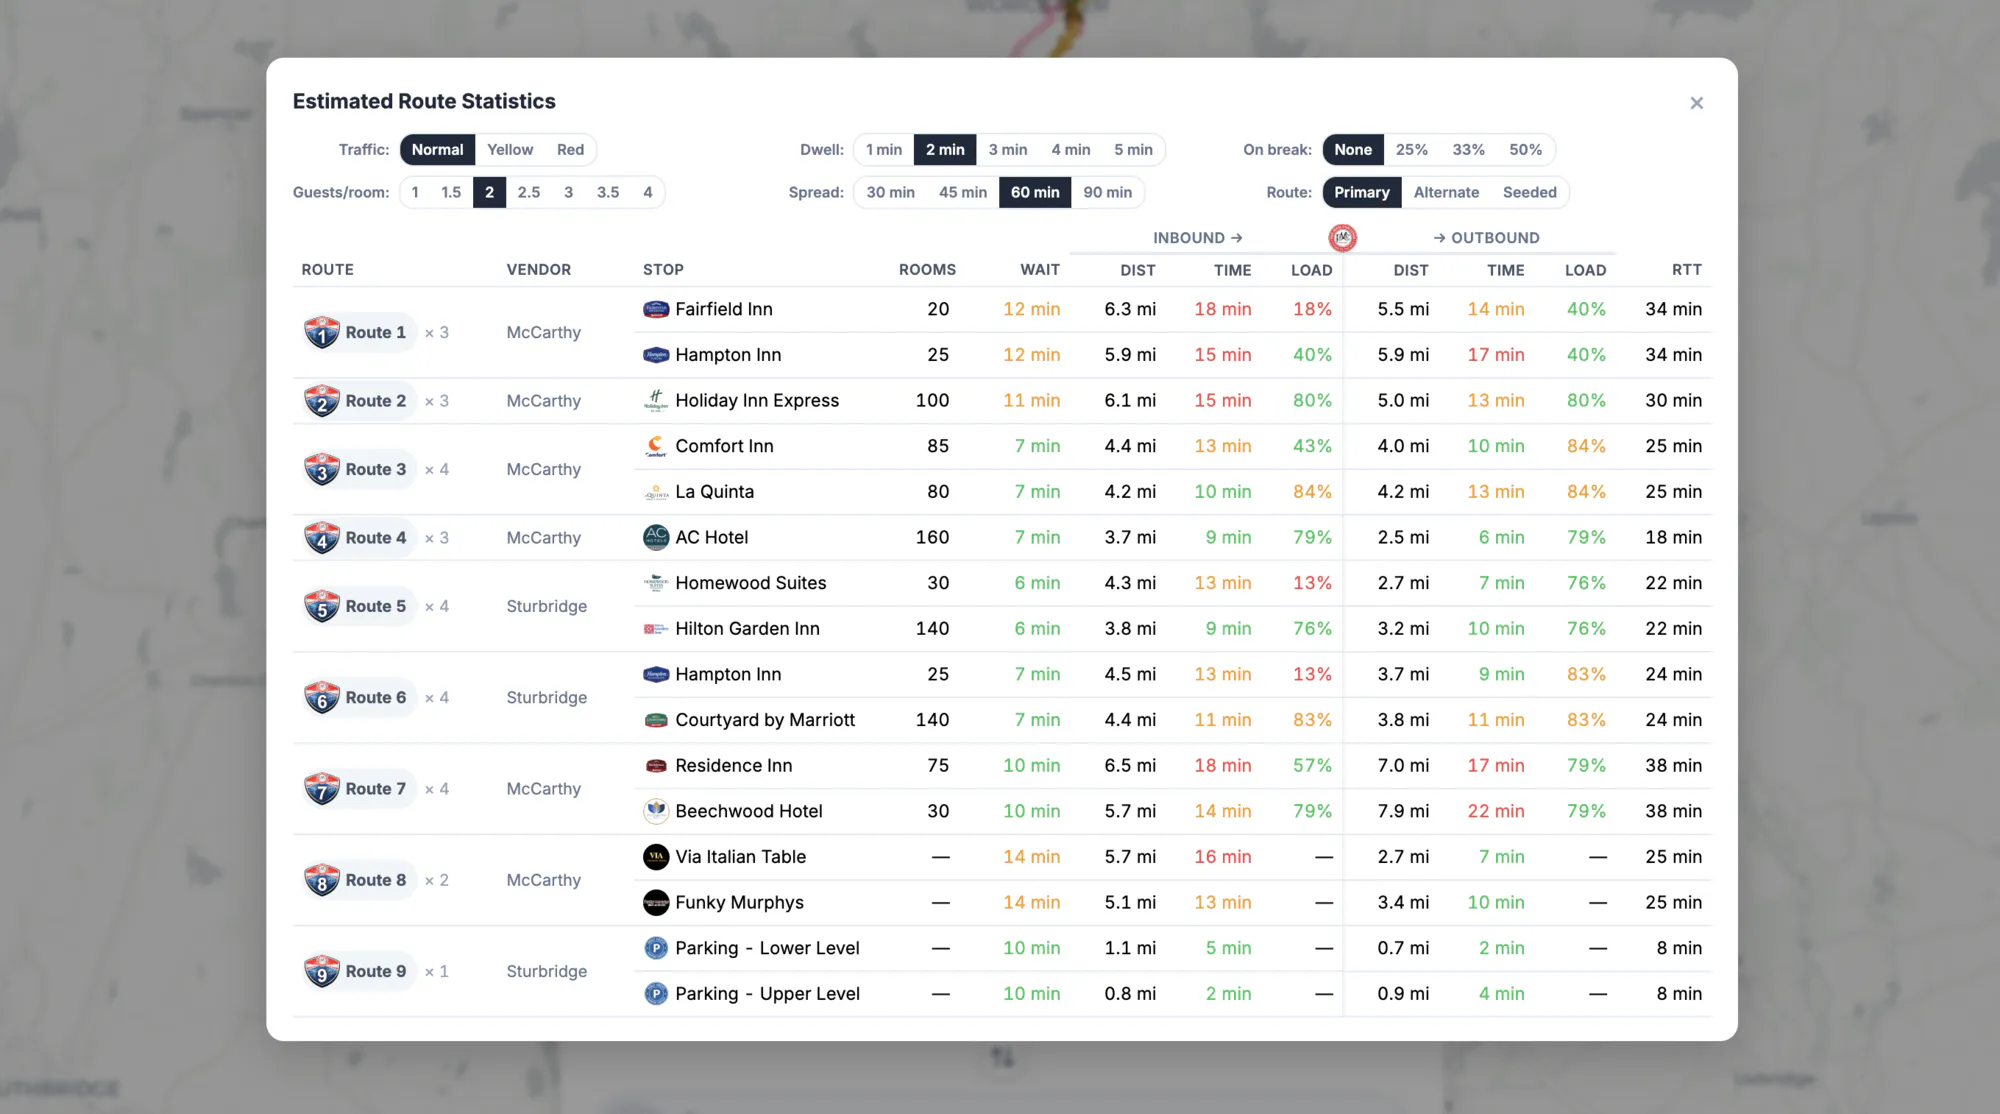
Stress-test your route plan before the event. Add vehicles, change headways, and see what your passengers would experience — so you make staffing decisions on evidence.
Every tracker reports its own charge and last fix, so you hear that a unit is fading with hours to spare rather than when a vehicle silently drops off your map.
Anything that moves at your event can carry a tracker, and anything carrying a tracker can have an ETA. We cover all of it with the same map, the same dispatch console and the same after-action report — you aren’t buying a shuttle tool from us and then a second tool for everything else.
Analytics & after-action reporting
Most shuttle debriefs are anecdote — the one complaint someone remembers, the route a volunteer thought was busy. We keep and analyse every position from every vehicle, so your debrief is measured instead: what each group actually experienced, where your fleet was under-used, and which changes would move the needle next year.
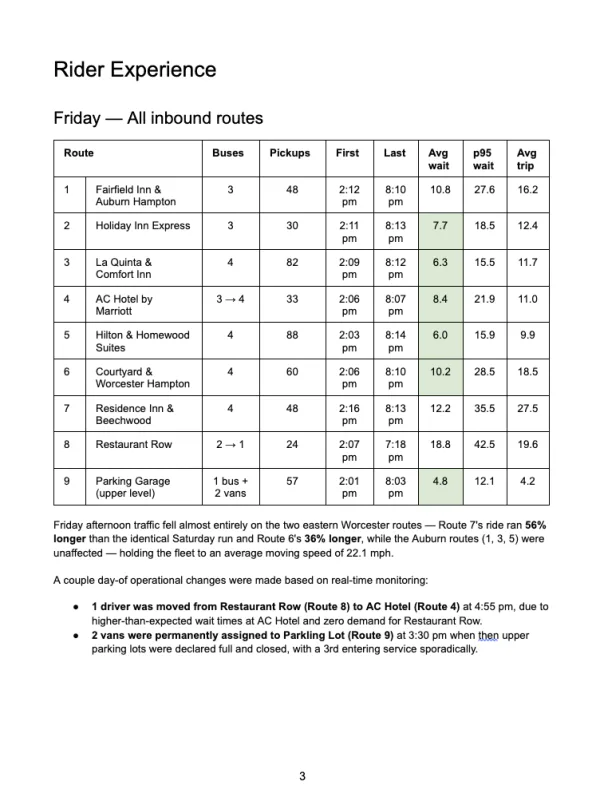
Wait and on-vehicle time, per route and per direction, as average, median, 90th and 95th percentile — so you see the worst experience instead of averaging it away.
Pickup counts, first and last service times, headway between vehicles, dwell at each stop, and full round-trip times per route.
Distance, driving versus stopped time, average and maximum speed, battery consumption and break timing — per vehicle, per operator, per day.
How many vehicles sat at your venue over the day, split into boarding, queued behind another vehicle on the same route, and on break — with lot utilisation against your capacity.
We score your pre-event estimates against what actually happened, route by route, so next year’s plan starts from measured times rather than free-flow map estimates.
We hand you every GPS position as CSV, enriched with route, stop and break status. We lock nothing up — it’s your event’s data.
Results: Proven in the field
A two-day charity cycling event starting in Worcester, MA: 12 hotels, 900+ rooms, nine routes, a parking garage shuttle, and a Saturday morning where thousands of riders had to reach the starting line in time.
Pricing
We offer a flat price per event route. Support as many passengers as you need.
We typically price events like yours at
—
for your entire event, up to 7 days.
Next step
Send us your hotel list and venue and we’ll build a working route map for your event, then walk you through the passenger app, the dispatch console and a real after-action report.